
Compare several weeks or days and observe an improvement from the moment you started at Orbisk.
In the dashboard you can see exactly when and what food you discard in the bin. In this article we share with you how you can combine the graphs, so you can see the progress of your food waste stream.
1. Graph: "total wight per week"
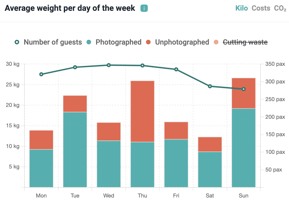
2. Graph "Average weight per day of the week"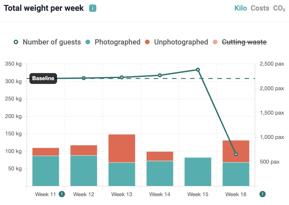
The progress of the total amount of weight per week
The first graph, total weight per week, shows the number of kilograms of food waste per week. This graph changes by selecting a different time period in the filters at the top of the dashboard. This way, you can compare weeks.
NOTE: You can only select consecutive periods in the time filter.
The flow of the number of kilograms on a Monday
Is Monday always an outlier, and have you set an objective to reduce it? The following steps allow you to check the progress on Monday (or any other day of the week).
1. Select a time period of the number of weeks you want to view.
2. Select 'Monday' in the 'day of the week' filter.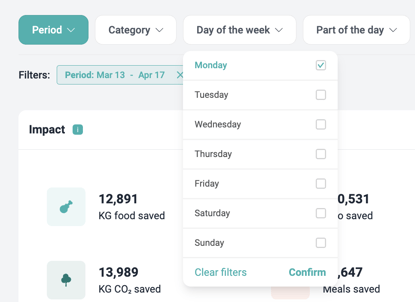
3. Then have a look at the graph: total weight per week. This chart now only shows the Mondays of all selected weeks. This way, you can see if the desired decrease has been achieved!
Remove filter?
Click on the cross next to the selected filter to deselect it.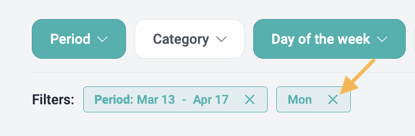
Are you still left with questions after reading this article? Feel free to send us an e-mail to support@orbisk.com or call us on +31 302270651.