The HQ View provides an overview to people who manage multiple locations. In this article we explain how you can use the overview and which data you can read.
You can navigate to the HQ view through the left side of your dashboard.
In the HQ view you will find various information about all your locations, such as:
- The total impact,
- The total savings.
The first overview looks like this:
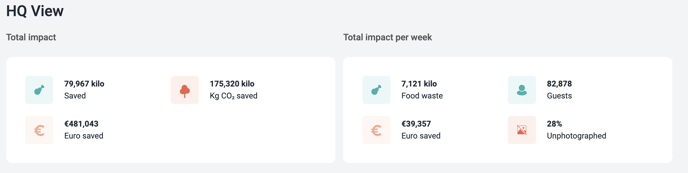
The total impact is shown on the left. This means the total impact of all locations together, during the period in which Orbisk has been active. In the overview above, for example, roughly 80,000 kilos of food has been saved, which is equal to nearly 500,- euros!
The total impact per week is shown on the right. The percentage of unphotographed weight is also shown here. Which means that (in the example above) 28% of the registered kilos do not have a corresponding photo. So we don't know which product has been thrown away.
The second overview looks like this
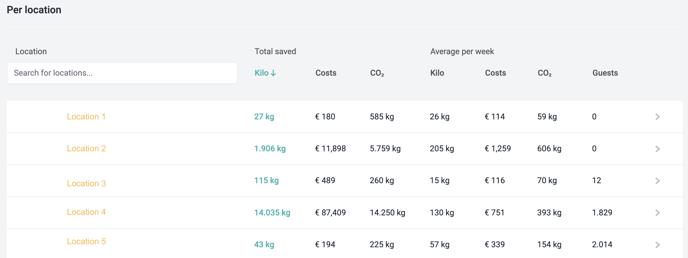
This overview indicates the total savings in terms of food waste, costs and CO2 emissions per location. The average per week is also shown here, so that you can clearly see whether the goals are being achieved.
As soon as you click on the arrow next to the guests, you automatically go to the dashboard of that location. So that see specific data for the location.
What is this useful for?
You can easily set business objectives from the headquarters overview. But you can also measure and adjust the individual goals of locations.
Are you still left with questions after reading this article? Feel free to send us an e-mail to support@orbisk.com or call us on +31 302270651.